Two of us, Marie Naka and Jessica Cruz, worked together to design and teach a hands-on inquiry-based basic science lesson about Climate Change and carbon emissions because we wanted to increase the level of complexity of our lesson while still addressing multiple needs and grade levels of this mixed-age after school program. Additionally, we believe students should have an understanding of climate change and our carbon footprints, as this is a current and ongoing issue that must be changed.
Classroom Context
This is the second lesson out of three that was taught at Trinity College Boys & Girls Club to a group of about 10 elementary and middle schoolers from various schools in Hartford. The students are all learning different things in school and, due to their different ages, have different levels of ability and interest. In this lesson, we aim to engage all students despite the variety in demographics. While students have not expressed direct interest in the topic at hand, we believe it to be an important topic for students to interact with.
Student Learning Objectives
- Students will relate carbon emissions to climate change. (MS-ESS3-5)
- Students will examine the factors that affect carbon emissions.
- Students will weigh decisions related to how they can address climate change in ordinary life planning. (MS-ESS3-3)
Guiding Question
How can we lower our carbon emissions?
Learning Activities
Launch
To introduce the Guiding Question, we launched the lesson with a Greenhouse Gas Effect analogy using a car in the sun example (idea from this lesson). To do this visual, we used a poster and our imagination.
To set the scene, we told students to imagine a hot summer day and that during the summer, we bought a car! (Then placed a car cutout onto the poster) We continued to tell them that while we are at the B&Gs Club for multiple hours, the car is sitting outside in the sun and that soon, we want to get in the car to drive home. We then asked, what was happening to the car while we were at B&Gs club? How does the car feel when we get in?
Assuming students have experienced the inside of the car heating up when under the summer sun, using a marker and the poster, we established how the car heats up by asking and drawing the following:
- Where does the heat come from? (draw/emphasize sun rays)
- How does the sunlight get into the car? (draw arrows from sun rays to through the windows and explain how the light turns into heat)
- Thinking about what we feel when we get in the car, what happens to that heat? (draw arrows showing heat bouncing around in the car)
Figure 1. Car metaphor of greenhouse gasses.


Then, we put up a poster diagram of the Greenhouse Gas Effect and discussed the similarities to the car example.
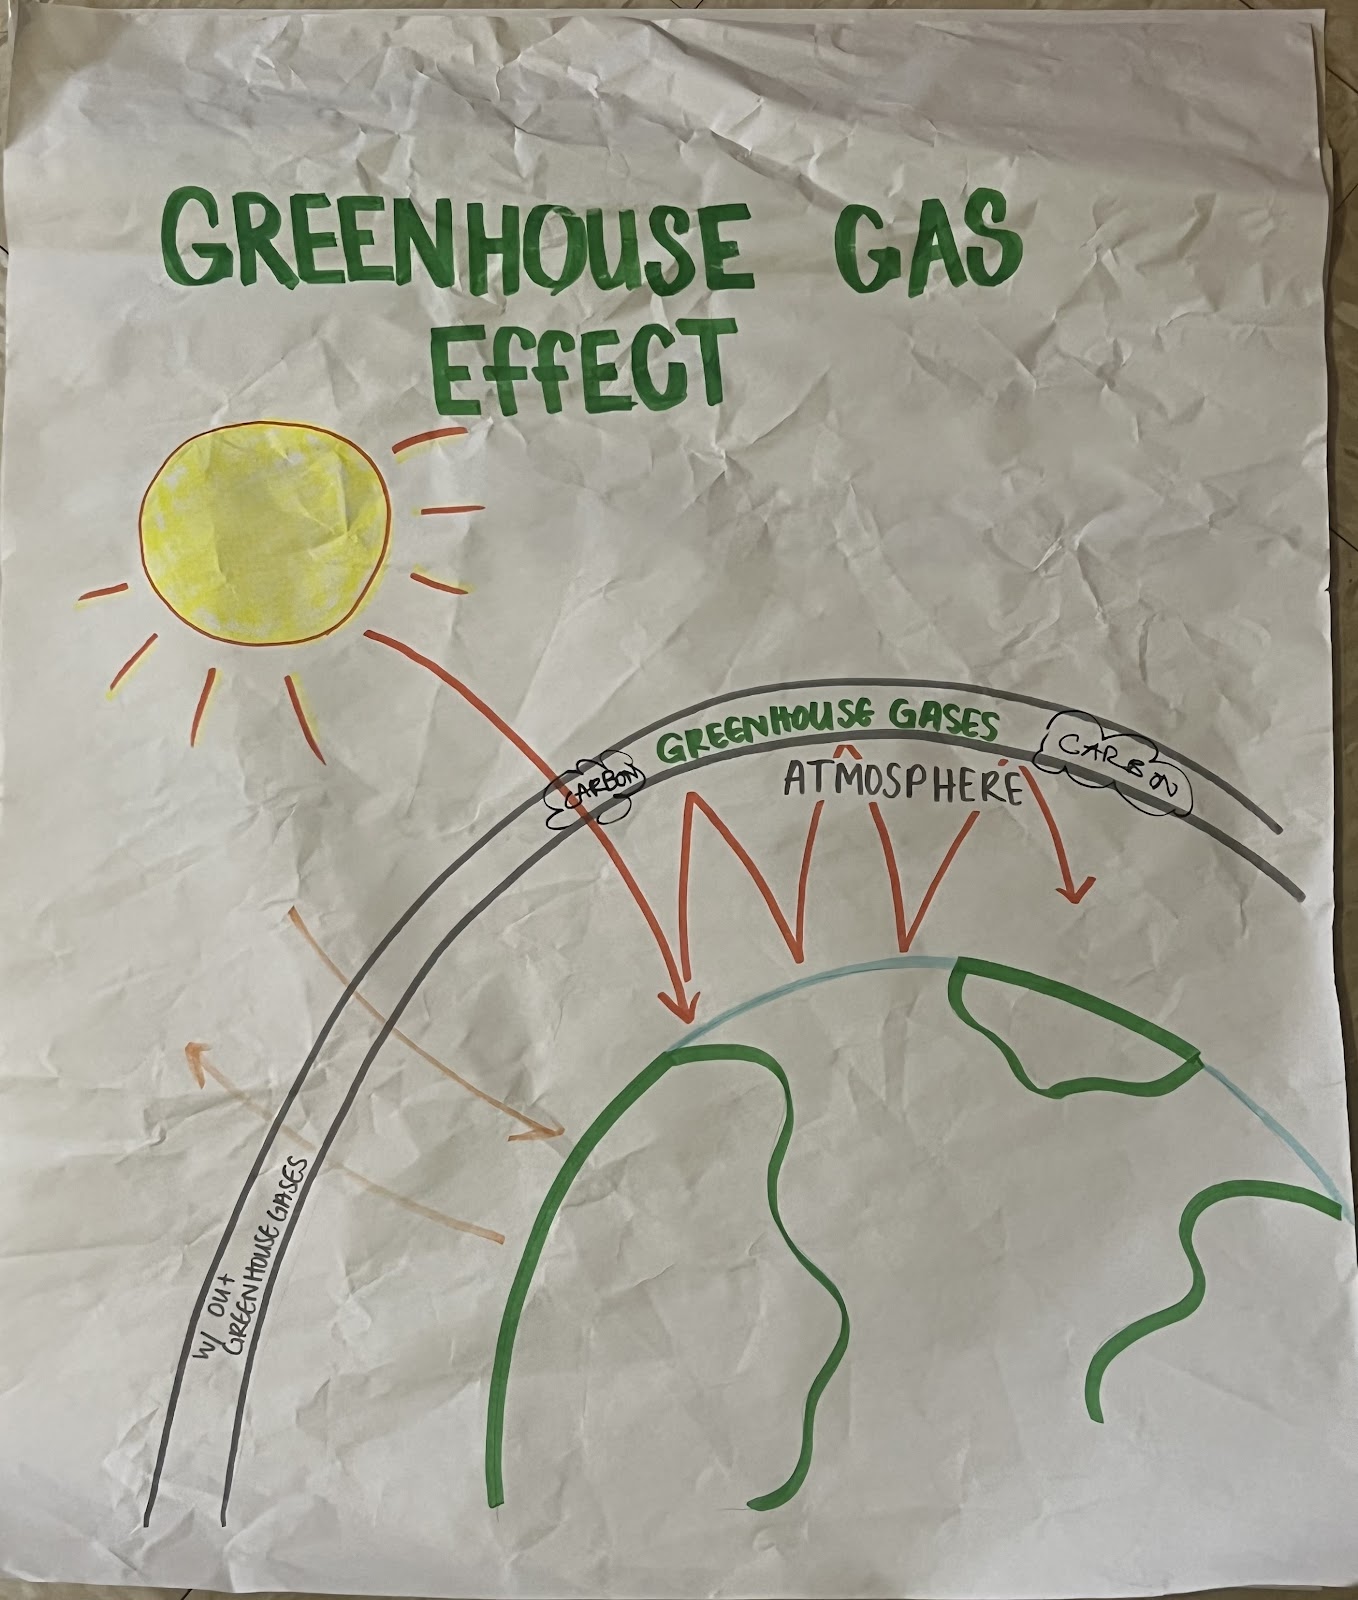
We also discussed how the car example happens on a bigger level to the earth as the sunlight passes through the Earth’s atmosphere and turns to heat, then the heat gets trapped, not by windows, but by greenhouse gasses—substances like carbon and methane.
From there, we share the big, guiding question: How can we lower our carbon emissions?
Carbon Emission/Footprint Activity
To begin this activity, we asked students to think of examples from their lives that produce carbon. Then, we split students into groups of 3 and gave out pictures of the following: car, truck, landfills, electricity. Each group was asked to order carbon emitters by how much they thought those factors contribute to the Greenhouse Gas Effect. Then, we revealed the correct ranking (EIA, 2023; ATSDR, 2001) on a poster and asked the class to compare what they had and discuss 1) if anything surprised them and 2) what their thought processes were for how they ordered the carbon emitters.

Carbon Budgeting Game
Using what they now know about the Greenhouse Gas effect and some carbon emitters, this activity allows students to think about how they can reduce excess carbon emissions. We also note that we are all going to have carbon footprints (i.e., breathing), but we ask students to consider how we can make less of an impact.
In this activity, students stayed in their groups and there were two rounds of the game.
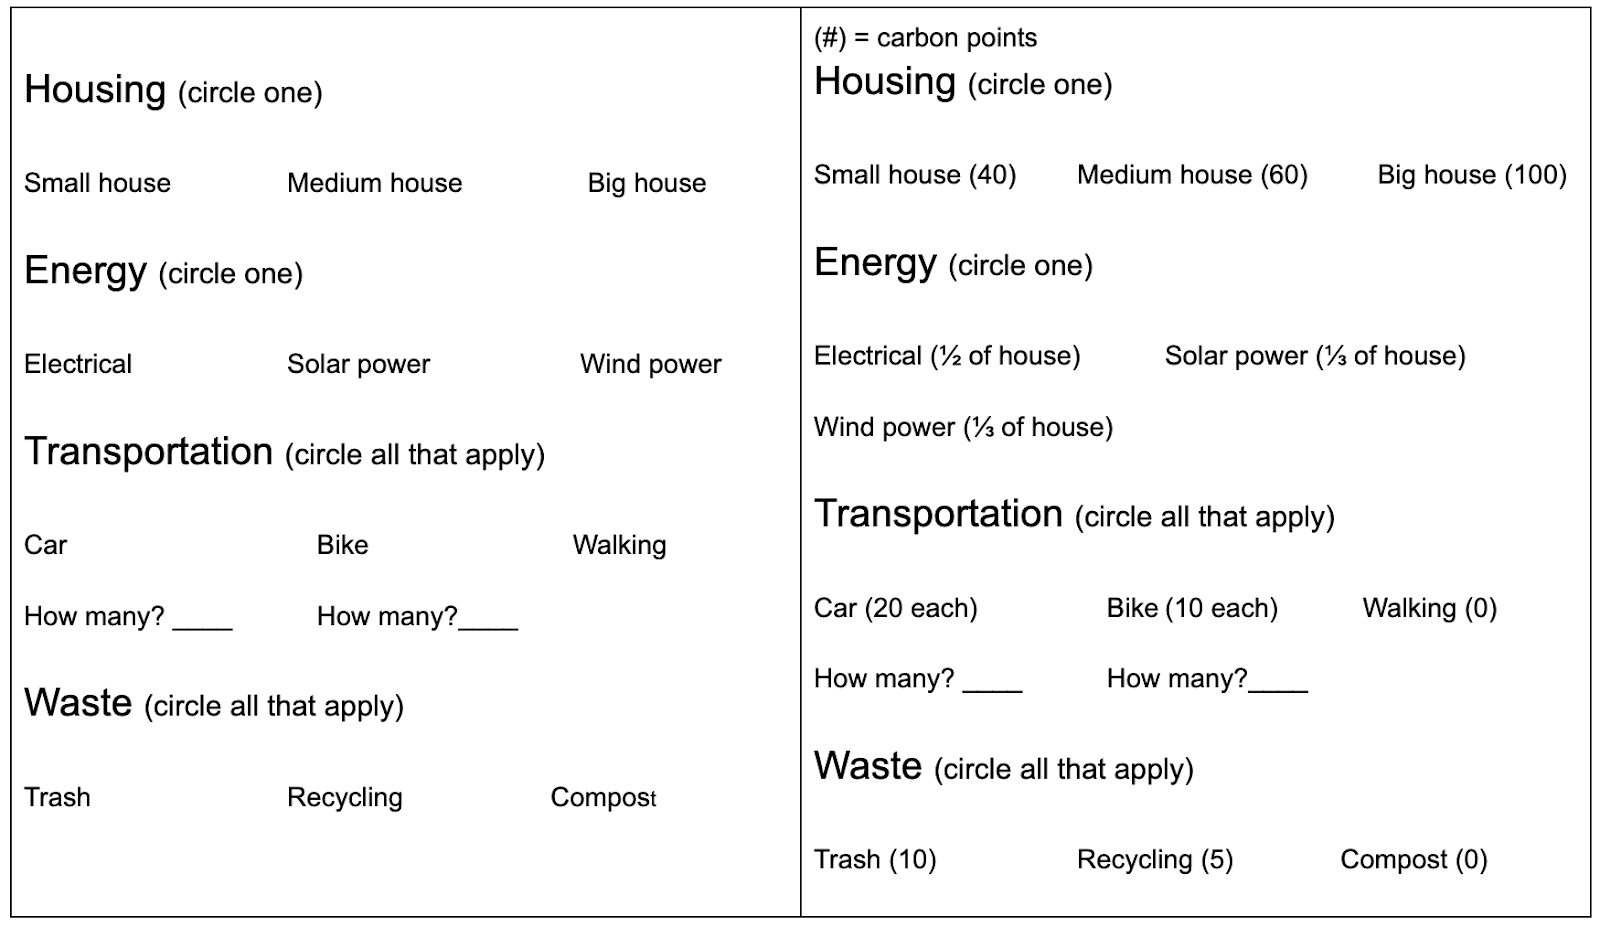
First round: Students did not know the carbon “prices” of what they chose. Each group got a worksheet (left side of the table) of different things they could choose to have in their houses.
Then, we calculated the number of carbon points each group spent (values from the right side of the table) and discussed how different choices had different carbon emissions.
Second round: Each group got a chance to rethink their decisions with the knowledge of the “prices” and the amount of carbon different things emit. They received a new worksheet (right side of the table) and worked with their groups again to see if they could make a house that they were still happy with that had lower carbon emissions.
Closing
Finally, after their second round of house planning, we referred back to the guiding question and discussed the following:
- How did you try and lower your impact for your house’s carbon emissions?
- How did you make your decisions for your house for the first round?
- How did you make your decisions for the second round? Did you make changes? Why?
Furthermore, we briefly discussed larger effects that come from Greenhouse gas emissions (Climate change/global warming) like harsher weather (ex. More and worse forest fires) From this, we discussed:
- What can you do in your daily life to lower your carbon emissions?
- What fun things can you still do while lowering your carbon emissions?
Challenging Inequity
Our lesson was taught to a mix of students across grade levels, ages, and schools. It attempted to engage multiple levels of learners more so than our previous lesson, so we decided to center the lesson around a topic that impacts all students no matter their knowledge or skill levels. The accessibility of the lesson to different groups of students falls into the principles of Universal Design for Learning.
Assessment
Before Teaching
We planned to capture student learning through our whole-class discussions during the interactive poster decisions. Additionally, we would look at the shifts in decisions from rounds 1 to 2 of the house planning activity, and we’d talk to students during and after the activity to gain an understanding of the reasoning behind their choices.
After Teaching
Our assessment went almost entirely as planned, and learning was also shown in the answering of the big question at the end of the lesson.
We had to do a little bit of prodding in the beginning to get students thinking in the right direction when we were trying to establish the greenhouse gas effect through the car metaphor, but they were able to use the metaphor (which they could all relate to) to wrap their minds around what the science behind a car heating up in the sun. When we turned to the greenhouse gas effect poster, they realized quickly how something similar occurred to the Earth, which they identified to be global warming.
During the carbon ranking activity, our conversation after revealing the answers was very fruitful. We had three groups of students, and only one of them correctly guessed the order of the emitters. The other groups thought that electricity wouldn’t be as big of a contributor, or that trucks would be a lot more of a contributor than they were. When we showed the class the answer, they were surprised, but after a few seconds of thinking, a student realized that electricity is used all over the world by most people. Then another student pointed out that electricity is needed to make and run the other items on the list, which prompted other students to start listing the ways electricity is used in the processes of cars, trucks, and landfills.
When we got to the house planning activity, there was a bit of a learning curve, which we got to see clearly on the round 1 sheets vs. the round 2 sheets. Below are the worksheets from each group.

In the first round, Group 1 chose a big house, solar power, four bikes, and compost. This group had, during the carbon ranking activity, gotten the ranking completely correct. Possibly remembering the things we had identified to emit carbon from that previous discussion, these students made choices that led to a somewhat middle-of-the-road “carbon score,” as we dubbed it, of 170. One of the students in the group was confused about what compost was, but the other student knew and explained that it was, instead of throwing away food scraps, making it so they turn into dirt and help plants. The first student excitedly agreed to choose that option.
Receiving the second worksheet, the students lowered their carbon score to a 60, 110 points less than before, by getting rid of their bikes and moving to a small house. The switch from solar power to electrical is confusing, though; this group knew that electricity emitted more carbon, but they switched this anyway. It’s possible that they were using the numbers provided on the second sheet to inform their decisions and create a lower footprint, and they might have been thrown off by the fractions we used, thinking that ⅓ was bigger than ½. We did not get a chance to ask the group about this decision.

For round 1, Group 2 chose a big house, electrical energy, three cars, and trash. They most likely chose the options that were familiar to them, not thinking about the underlying purpose of the activity, which worked well to show their learning come the second round. After some compromise within the group, the students decided their second round choices would be a medium house, electrical energy, a bike, and compost. They had the highest carbon score in both rounds, but they also had the biggest decrease in scores, going from 220 in round 1 to 100 in round 2, a 120 point decrease.

Group 3 chose for their first round a big house, wind power, two bikes and walking, and recycling and compost. Their first score was 155, the lowest of the three groups. They lowered this to a score of 53 ⅓ points, a decrease of 101 ⅔ points, by switching to a small house, solar power, getting rid of their bikes, and sticking just to compost. This group had been shocked about the high emissions created by electricity, and we can see that it stuck by looking at their energy choices for both rounds as they stayed away from electrical energy.
In all groups, whether the students realized it or not, there was some ignorance of practicality in hopes of getting a lower score. Realistically, you can’t walk everywhere, and it would be incredibly difficult to not produce trash or recycling at all. Furthermore, where all three groups had chosen big houses originally, a small house might not actually be what they’d want except for the fact that it has fewer points attached to it. Group 2 was going to go from extreme to extreme, high emissions to lowest possible, but a discussion with them (see the reconstructed dialogue under “Reflection”) helped them consider what choices they’d actually be happy with while still considering the impact of their carbon emissions.
Finally, we talked with the whole class about the impact of climate change, and we revisited our big question.
Students were able to come up with different effects of climate change and carbon emissions by considering what they’d learned were big contributors of carbon. For example, a student thought about how cars emit carbon, then realized that this was connected to how cars cause pollution.
When we asked students to answer the guiding question, they were brimming with ideas about how to decrease their own carbon emissions. Using the knowledge they had acquired that electricity emits a lot of carbon, they thought of tons of ways to lower carbon emissions by reducing their use of electricity—watching less TV, using their phones less, turning off the lights when they aren’t using them, and so forth.
Reflection
During our second lesson, many more students talked and engaged with the questions/lesson compared to our first lesson. An aspect of this lesson that went especially well was our improvement for creating a lesson that can challenge ages from elementary schoolers to high schoolers. There were at least two high schoolers in the room, who were not as engaged as the younger students and were on their phone for most of the time but by the end, one of the high schoolers still shared what they learned after we worked with them a little more during the group activities. This can be seen below in Figure 10, in which a high school student and Jess work together to piece together the effects of carbon through the Greenhouse Gas Effect poster and she shares the effects of global warming like forest fires. Additionally, this engagement was followed in our closing discussion where almost all students of all ages added to the discussion (Figure 8).
Figure 10. [(right back side of the room) Discussion with student about the Greenhouse Gas Effect and why we should aim to lower carbon emissions due to what they know about global warming.
With this, it was easier to engage more students when asking our questions as students overall showed that they were interested. This can be due to this lesson’s application to real-life at any age; which we could use in the future for engaging the wide range of students. Moreover, we continued to be able to adapt to how students were reacting to questions by framing questions to probe more answers and thinking. For example, during our Carbon Emissions Ranking activity, we spoke with one group of two students and wanted to understand why they ranked their carbon emitters the way they did. Below is our conversation about that, and this is also similar to how we were able to engage the high schoolers.
Teacher: So what are we thinking [about the ranking]?
Student 1: Electricity, Landfills, Trucks, Cars
Teacher to Student 2: What do you think?
Student 2: Same thing
Teacher: Why do you think cars are at the end?
Student 1: Because electricity is used to make cars.
Teacher: Oh so, you’re thinking electricity must be more than cars because electricity helps make the car.
Teacher to Student 2: Did you have another idea for why cars should be least?
Student 2: Because cars also have a lot of electricity.
So student two shared agreement in the beginning which showed their group’s learning, but we wanted to know what thoughts he had on the ranking. Thus, further questions were asked for opportunities for the second student to share. In the end, he added that not only do cars need electricity to be made, but a lot of cars have electricity and use electricity itself (ie. electric vehicles) which would add to why electricity is at the top of the ranking. To add, this allowed not only for more engagement, but smoother transitions and pacing for the rest of the lesson since there was a flow of interaction.
An aspect of this lesson that was unexpected, but did help, was that the students saw the Carbon Budget Game as a competition. This was not particularly the plan but this added a goal that the students could consider and further their thinking about their house planning. After the first round of the Carbon Budgeting game, students found out their Carbon points. At first students thought that the more points you had, the better you were doing in the game–which makes sense to assume–but in our game, they wanted to have fewer points to lower their carbon emissions. So, this competition and clarification of the game would consolidate their learning about carbon emissions impacts and allow for students to be strategic with what they were choosing to produce less carbon. We also wanted to emphasize that lowering carbon emissions doesn’t have to mean giving up everything we like. We told students that everyone is going to have a carbon footprint no matter what we do, but we can take small actions to reduce those footprints while still doing cool things and living our lives the ways we want to. This learning and consolidation of this concept can be shown in the following conversation between a group and one of the teachers:
*Group 2 (Figure 6) has chosen for their second round a small house, electrical energy, walking, and compost. In round one, they had a big house, electrical energy, 3 cars, and trash.*
Teacher: You guys decided to go for a small house?
Student 1: Yeah. He [student 2] wanted a medium house, but he [student 3] said we should do a small house. I still wanted the big house.
Student 3: The small house has the least points.
Teacher: Yeah, but you shouldn’t choose it if you’re gonna be unhappy with it. Should we compromise and get the medium house?
*Students agree.*
Teacher: That way you’re still reducing your emissions from before, but you’re happy with this situation. Now what about your transportation? You guys had three cars before; are you okay with going from that to committing to walking everywhere?
Student 2: I didn’t sign up for that. He [student 3] thought we should do walking.
Student 1: We could do bikes.
Teacher: Yeah, that’s easier than walking but doesn’t put out as much carbon as cars.
*The students circle bikes.*
Teacher: Okay, and if we add up all the choices, *walks them through the math* your score is 100. Look how much you’ve reduced from your first round [220]! And you’re still happy with this plan.
As mentioned above, students were able to understand the impact of carbon emissions through their decision making for their second round of house planning. Furthermore, each group lowered their carbon emissions from the first round to the second round. With that, students especially showed their connection of how electricity is the highest contributor for carbon emissions in both the Carbon Emission Activity and the Carbon Budgeting Game. To add, students discussed why this all matters. In Figure 8, students shared how carbon emissions are contributors to climate change effects like forest fires, pollution, cancer, smog. Building upon that, when students were asked the big question again, students discussed how they can lessen their carbon impact, especially in relation to electricity. For instance, students shared many small things they could do like turning off the light, reading (instead of watching media like TV), going to sleep, going for a walk, making electric cars, etc. (Figure 9) Therefore, students effectively met all three objectives as students shared their thinking about the highest sources of carbon emissions as they ranked some of the factors (Objective 2), how those factors can connect to their housing plans and their carbon points (Objective 1 and 3), and ways they can lessen this in their every-day lives to help with climate change in the closing activity (Objective 3).
Students showed their thinking in moments of discussion where they were able to connect their prior knowledge to the lesson and use each other’s ideas to make further connections. For instance, when we revealed the correct order in the carbon ranking activity, students’ realizations as to why (electricity is common and highly used, electricity is needed to make and use the other items) prompted lots of links to all the different reasons for the order of the ranking. Then, when we asked students the big question at the end, it only took one student bringing electricity up again for all the other students to generate suggestion after suggestion using that knowledge to reduce our carbon emissions.
Students did exhibit some confusion when it came to our system of carbon points, not understanding exactly what they meant, but it probably still would have been confusing to use real, extremely large values (tonnes of carbon). Also, their confusion over how the points should impact their decisions was generally assuaged by a short conversation with the students about their choices and reasoning.
The length of our activities is definitely an area for improvement, though. Both of our lessons have been shorter than we anticipated (though we did do some accidental rushing in the first lesson), so for our third lesson, we will try to think more about how to realistically budget out our time in order to achieve an engaging and fulfilling lesson for both us and the students.
Another mistake we had made, which we realized while we were teaching, was that we didn’t actually establish why climate change was bad. We had assumed that students would know why it was bad, but when we talked to them about why we should lower our carbon emissions, they said it was because it made the Earth hot. We did attempt to address this by adding the conversation onto the end of the lesson (Figure 9), which was good and conveyed that learning had taken place over the lesson, but the activities might have been more impactful if we’d had this conversation earlier in the lesson.
This lesson was certainly executed much more smoothly than our first lesson. There was an even broader range of ages this time, from a very young student (possibly second or third grade) to a sophomore in high school, and most students seemed to work well with the skill level of the lesson, with the exception of two older students. Even without obvious engagement from the older kids, the other students were definitely interested and seemed invested in the lesson. We were able to pace things more effectively, and whether it was the increased engagement or the lower number of students, it was easier for us to maintain clear communication that facilitated the completion of our activities. Additionally, this lesson’s topic, which was relevant to all students, seemed more engaging than that of our first lesson, which we knew was an interest of a few specific students. For our third lesson, we will try to continue focusing on topics that affect all students and are current themes in their lives.
Sources
“Carbon Budget Monopoly: Instructions for Volunteers.” Center for Biological Diversity, 2024. https://www.endangeredspeciescondoms.com/pdfs/CarbonBudgetMonopoly.pdf
“How Much Carbon Dioxide Is Produced per Kilowatthour of U.S. Electricity Generation?” U.S. Energy Information Administration (EIA), 2023, www.eia.gov/tools/faqs/faq.php?id=74&t=11#:~:text=In%202022%2C%20total%20annual%20U.S.,billion%20short%20tons%E2%80%94of%20carbon.
“Landfill Gas Primer – an Overview for Environmental Health Professionals.” Centers for Disease Control and Prevention, 2001, www.atsdr.cdc.gov/hac/landfill/html/ ch2.html#:~:text=The%20more%20organic%20waste%20present,by%20the%20bacteria%20during%20decomposition.
“MS-ESS3 Earth and Human Activity.” MS-ESS3 Earth and Human Activity | Next Generation Science Standards, www.nextgenscience.org/dci-arrangement/
ms-ess3-earth-and-human-activity. Accessed 24 Mar. 2024.
TeachingEngineering. “Global Climate Change – Lesson.” TeachEngineering.Org, 17 June 2022, www.teachengineering.org/lessons/view/cub_weather_lesson06.